New Relic is a SaaS that monitors infrastructure and applications, and there is Datadog as a similar service. It seems that the pricing plans were changed drastically in 2020, and it charges according to the transfer volume and the number of admin users. Therefore compared to Datadog, which charges for hosts and additional features, there is an advantage when managing a large number of instances with a small number of people. And Datadog pricing plans are relatively complex and hard to estimate how much the bill will be in an environment where the number of instances increases and decreases frequently, while New Relic’s plans are easy. Even if you try to new features, the unit price will not increase, so you can easily try it.
On the other hand, if there are a lot of admin users or the number of requests is huge so the transfer volume about APM is increased, it may be more expensive than Datadog. In many cases, user charges are the majority, so if you replaces some Full platform users with half priced Core user or free Basic user, the charges will be reduced but while Dashboard and Alert are available to all users, APM screens are available to only full platform users. The transfer volume charges can be reduced by Drop data. It cannot be set from the screen for now, so it is necessary to use NerdGraph. The following is an example of setting with Terraform.
Query resources with NerdGraph, New Relic’s GraphQL API - sambaiz-net
resource "newrelic_nrql_drop_rule" "heavy_path" {
  account_id  = *****
  description = "Drop transactions data"
  action      = "drop_data"
  nrql        = "SELECT * FROM Transaction WHERE `request.uri` = '/heavy_path'"
}

resource "newrelic_nrql_drop_rule" "heavy_path_span" {
  account_id  = *****
  description = "Drop spans data"
  action      = "drop_data"
  nrql        = "SELECT * FROM Span WHERE `request.uri` = '/heavy_path'"
}
I feel troubleshooting is relatively difficult. I faced some troubles such as sending no metrics or referencing old documents but the libraries and documents are OSS so I think they can be almost resolved by reading the code or sending a PR. However, there are informations which are not written clearly in docs, or even if they are written, it may be difficult to find them, so esecially if you use New Relic for the first time, although the user unit price will increase, pro or higher plan which have support may be better. New features, including CodeStream, which was acquired last year, are being actively developed, so I hope that the troubleshooting will be improved as well.
Make asking about codes and debugging efficient with New Relic CodeStream - sambaiz-net
AWS integration
Create a Role with ReadOnlyAccess and budgets:ViewBudget to AssumeRole from New Relic.
{
  "Statement": [
    {
      "Action": [
        "budgets:ViewBudget"
      ],
      "Effect": "Allow",
      "Resource": "*"
    }
  ],
  "Version": "2012-10-17"
}
For metric acquisition, the conventional method of calling the API regularly for polling, and the method of using CloudWatch Metric Steams streaming to Firehose are supported, and the latter is recommended. However, not streamed data due to more than 2 hours delay such as S3, and values that don’t exist in CloudWatch metrics, such as Budget, can be fetched only with polling.
Monitor AWS costs with New Relic - sambaiz-net
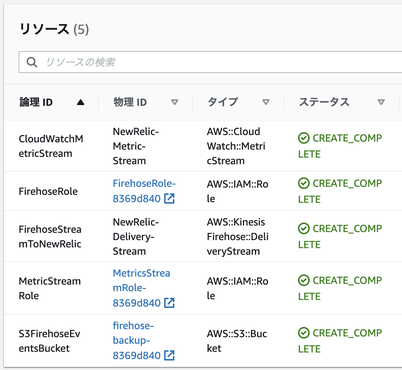
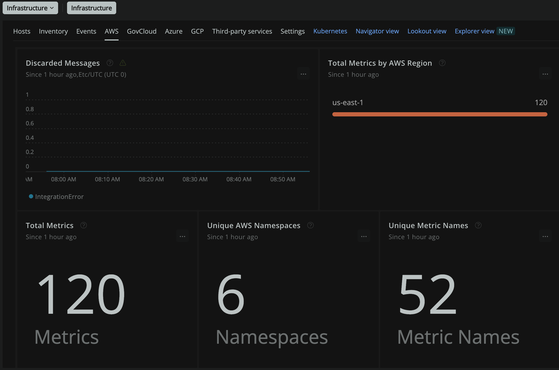
Required resources can be created by passing the License Key to the provided CloudFormation template. The following resources are created and the metrics are displayed on the New Relic dashboard.
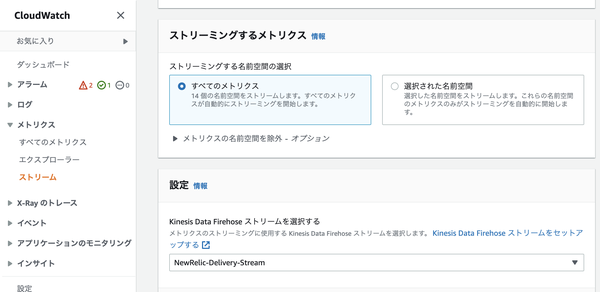
Looking at the created Metric Streams settings, it can find all namespace metrics are sent.
If the metrics are not sent, make sure the region, and you have not copied the wrong Key or Key ID.
Install an infrastructure monitoring agent
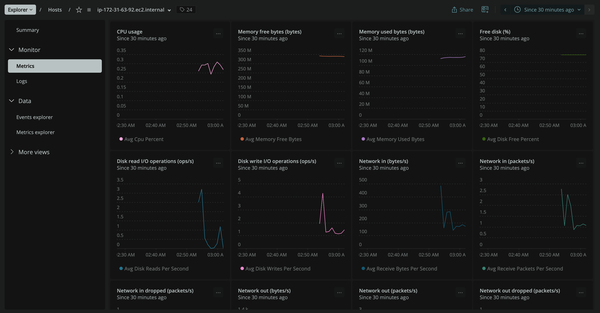
Install an agent to collect the CPU usage rate and network I/O etc. of the instance. The following commands are for Amazon Linux 2 (arm64).
$ echo "license_key: ****-" | sudo tee -a /etc/newrelic-infra.yml
$ sudo curl -o /etc/yum.repos.d/newrelic-infra.repo https://download.newrelic.com/infrastructure_agent/linux/yum/amazonlinux/2/aarch64/newrelic-infra.repo
$ sudo yum -q makecache -y --disablerepo='*' --enablerepo='newrelic-infra'
$ sudo yum install newrelic-infra -y
$ sudo systemctl start newrelic-infra
New Relic Flex
If following yaml file is put under /etc/newrelic-infra/integrations.d, metrics are generated from command outputs, HTTP responses or file contents, and it can be send on a regular basis.
For monitoring Fluentd, the value of monitor_agent can be sent with Telemetry SDK, but if use this feature instead, an application to send it is not needed to run on log aggregator. However, be careful that the larger the number of settings, the larger the amount of data.
fluentdのmonitor_agentのデータをGoでGoogle Stackdriverに送って監視する - sambaiz-net
$ cat /etc/newrelic-infra/integrations.d/fluentd.yml
integrations:
- name: nri-flex
  config:
    name: fluentd
    apis:
    - event_type: fluentd
      url: http://localhost:24220/api/plugins.json?@type=forward
Check the data with following NRQL.
FROM fluentd SELECT rate(average(buffer_total_queued_size), 1 minute) FACET `config.@id` TIMESERIES
By the way, if you set NRIA_IS_FORWARD_ONLY to true, the agent send only integrations data. This is useful when you want to use it alone, such as when running it as a Kubernetes sidecar that communicates with other containers in a Pod and sends metrics.
- name: newrelic-flex
  image: newrelic/infrastructure:latest
  env:
  - name: NRIA_LICENSE_KEY
    valueFrom:
      secretKeyRef:
        name: newrelic-secret
        key: newrelic-license-key
  - name: NRIA_IS_FORWARD_ONLY
    value: "true"
  resources:
    limits:
      memory: 300M
    requests:
      cpu: 100m
      memory: 100M
  volumeMounts:
  - name: nri-flex-config-volume
    mountPath: /etc/newrelic-infra/integrations.d
volumes:
- name: nri-flex-config-volume
  configMap:
    name: nri-flex-config
Log forwarding
Logs can be forwarded with Fluent Bit installed by the agent, self-installed Fluentd or Logstash.
Aggregate logs of spark running on an EMR cluster with Fluent Bit - sambaiz-net
$ td-agent-gem install fluent-plugin-newrelic
<filter foo>
  @type record_transformer
  <record>
    service_name ${tag}
    hostname "#{Socket.gethostname}"
  </record>
</filter>

<match foo>
  @type newrelic
  api_key ****
</match>
Logrus, a logger in Go, integration is provided, which adds following fields to the log and associate the request trace with the log. Any loggers are available if add these yourself.
func AddLinkingMetadata(m map[string]interface{}, md newrelic.LinkingMetadata) {
	metadataMapField(m, KeyTraceID, md.TraceID)
	metadataMapField(m, KeySpanID, md.SpanID)
	metadataMapField(m, KeyEntityName, md.EntityName)
	metadataMapField(m, KeyEntityType, md.EntityType)
	metadataMapField(m, KeyEntityGUID, md.EntityGUID)
	metadataMapField(m, KeyHostname, md.Hostname)
}
If log is linked, it can be jumped from Errors Event, which is helpful to troubleshoot.
About newrelic-lambda-extension and how it works telemetry without CloudWatch Logs - sambaiz-net
APM
APM is a feature to collect runtime information such as the number of Goroutines and GC execution time, as well as X-Ray-like request traces and show their summaries. The agent libraries are provided in C, Go, Java, .NET, Node.js, PHP, Python ans Ruby.
$ go get github.com/newrelic/go-agent
Integrations are provided for major WAFs such as echo and gin in Go, and this middleware writes Transaction associated with the request to the context and make it retrievable with nrecho.FromContext(c). Transaction that are not associated with a request are treated as Background jobs.
import "github.com/newrelic/go-agent/v3/integrations/nrecho-v4"
app, err := newrelic.NewApplication(
    newrelic.ConfigAppName("app_name"),
    newrelic.ConfigLicense("*****"),
    newrelic.ConfigDistributedTracerEnabled(true),
)

http.HandleFunc(newrelic.WrapHandleFunc(app, "/users", usersHandler))
e.Use(nrecho.Middleware(app))

// in middleware
/*
txn.SetWebRequestHTTP(c.Request())
c.Response().Writer = txn.SetWebResponse(rw)
c.SetRequest(c.Request().WithContext(newrelic.NewContext(c.Request().Context(), txn)))
*/

func handler(c echo.Context) error {
	txn := nrecho.FromContext(c)
	return c.String(http.StatusOK, "ok")
}
NewApplication() spawns a goroutine which hervests data and send it so if you new a Application each time without calling Shutdown(), the goroutine leaks.
If create a segment, the execution time of that section is displayed on the timeline.
func do(ctx context.Context) {
  defer newrelic.FromContext(ctx).StartSegment("do").End()
}
If wrap a HTTP request, a segment for the external request is created and average latency etc. are displayed on the Service Map.
client := &http.Client{}
client.Transport = newrelic.NewRoundTripper(client.Transport)

request, _ := http.NewRequest("GET", "http://example.com", nil)
request = newrelic.RequestWithTransactionContext(request, txn)

response, err := client.Do(request)
Custom metrics
When app.RecordCustomMetric(key,value) is called, metrics of Custom/ prefix are sent.
app.RecordCustomMetric("CustomMetricName", 132)
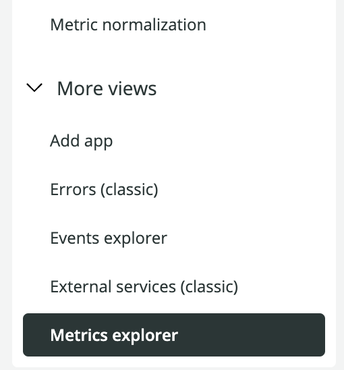
The metrics are not shown on Data explorer and you can see it on Metrics explorer of APM.
In NRQL, refer to newrelic.timeslice.value as follows. By the way, this timeslice data can’t be applied drop_rule, so you need to use Metric normalization instead.
FROM Metric SELECT count(newrelic.timeslice.value)
  WHERE appName = 'MY APP'
  WITH METRIC_FORMAT 'Custom/{name}'
  TIMESERIES FACET name
Characteristics of Metrics and Events in New Relic and queries in NRQL - sambaiz-net
Alert
Once you set a “condition” from charts in a Dashboards etc. to send an alert, and the condition is met, an “incident” is created and an “issue” is opened. Issue can be created per policy or condition, and in that case, multiple incidents are associated with one issue. When the status of the issue changes, a notification is sent.
custom incident description added to the notification can use templates such as {{tag.tags.Name}},
and it refers to the value of the incident’s payload,
but since the incident does not exist when the condition is created, it is troublesome to check the key.
Default Streaming method is Event flow, and it is not evaluated unless data arrives after the time set to Delay, so if it is sent unpredictably, use Event timer, which waits Delay time after the last data is sent to evaluate the Window, and fill data gaps if necessary.


